We Built a Free Fishing Map for Southern Baja: Meet the Cabo Bite Map
The Cabo Bite Map is a free daily map of the best water for marlin, tuna, dorado and wahoo from Cabo San Lucas to Magdalena Bay. How it works, and its limits.
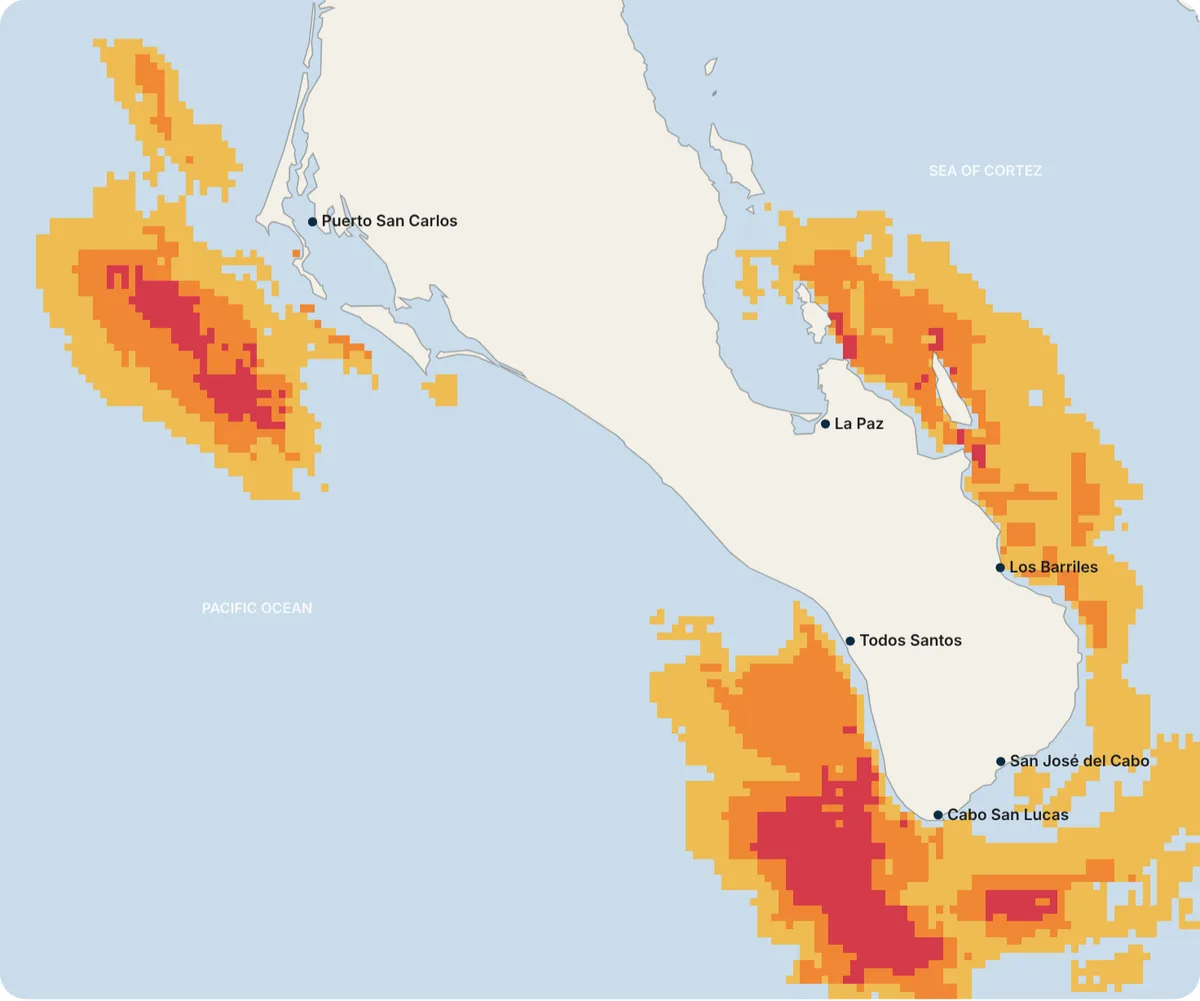
Blue marlin zones across southern Baja from a late-October NOAA satellite image. Red is Elite, orange Priority, yellow Candidate.
Every morning before sunrise, the captains at the Cabo San Lucas marina make the same decision: where to run. Pacific side or Sea of Cortez? The banks, or the blue water past them? That call decides the day, and for most of the history of sport fishing it lived in a captain’s head, in a radio call to a friend, or behind a paid satellite subscription.
Today we are putting a version of that morning decision on the internet, for free. It is called the Cabo Bite Map, and it covers the water from Cabo San Lucas to the East Cape, La Paz and Magdalena Bay.
Key takeaways
- The Cabo Bite Map is a free daily map of where today’s water best matches what each fish looks for. No account, no app, no ads.
- It covers 21 species: striped, blue and black marlin, sailfish, yellowfin tuna, dorado, wahoo, four bait fish and ten inshore and reef fish, from roosterfish and toro to snappers, grouper and yellowtail.
- It reads the water the way a captain does: temperature, temperature breaks, water color, depth, bottom structure, season and, for billfish, where their bait is.
- Save it to your phone’s home screen and it works like an app, on iPhone and Android, with no download.
- It is a beta. We are tuning it with our captains’ daily reports, and it rates conditions, not fish.
At a glance
| What | A daily fishing-zone map for southern Baja California Sur |
|---|---|
| Price | Free, no sign-up |
| Area | All of Baja California Sur: Los Cabos, Todos Santos, East Cape, La Paz, Loreto, Mulegé, Magdalena Bay and the Pacific up to Guerrero Negro |
| Species | 21: offshore, bait for billfish, and inshore and reef fish |
| Data | NOAA satellite water temperature and color, NOAA ETOPO 2022 depth, our species calendar |
| On your phone | Save it as an app on iPhone or Android, with our logo. No app store. |
| Status | Beta, updated as new satellite images arrive |
| Where | topanglerscharters.com/bite-map (en español) |
Why we built it, and why it’s free
It started with our captains. They asked for ocean currents and typed GPS coordinates in the app we built for them, and once the satellite data was on their screens the next question was obvious: can the app show where the conditions line up? So we built a zone calculator for them.
When we saw it working, keeping it to ourselves felt wrong. Our family has fished these waters since 2004. Sport fishing gave us a business, a living and a place in this community, and it brings visitors to Baja California Sur every year. The Cabo Bite Map is our way of giving something back: to the angler planning a first trip, to the local with a panga, and to anyone who loves this water as much as we do.
How it reads the water
The map splits the sea into squares of about 2.5 to 3 kilometers, roughly a mile and a half on a side, and the water along the coast into squares of about 900 meters for inshore fish. For each square and each species it asks the questions a captain asks:
- Is the water the right temperature? Every species has a range it prefers, from NOAA’s daily satellite water temperature.
- Is there a temperature break? Where warm and cool water meet, bait gathers and predators follow.
- What color is the water? Satellites measure chlorophyll. Clean blue water and the edge where it meets greener, richer water both matter, in different amounts for different fish.
- How deep, and what’s on the bottom? Banks, seamounts and drop-offs push water up and hold bait. Wahoo, for example, hunt around structure far more than dorado do.
- Is it the season? The same water scores lower when a fish is out of season, using the calendar on our species pages.
- Where is the bait? Marlin and sailfish follow skipjack and bonito, so their score includes a bait map. You can open the bait map itself under “Bait for billfish.”
Each square gets a score, and the best water of the day becomes three tiers: Elite (red, roughly the top 3%), Priority (orange) and Candidate (yellow). The tiers also have a minimum score, so on a poor day you will see few zones or none. The map never invents good water to fill the screen.
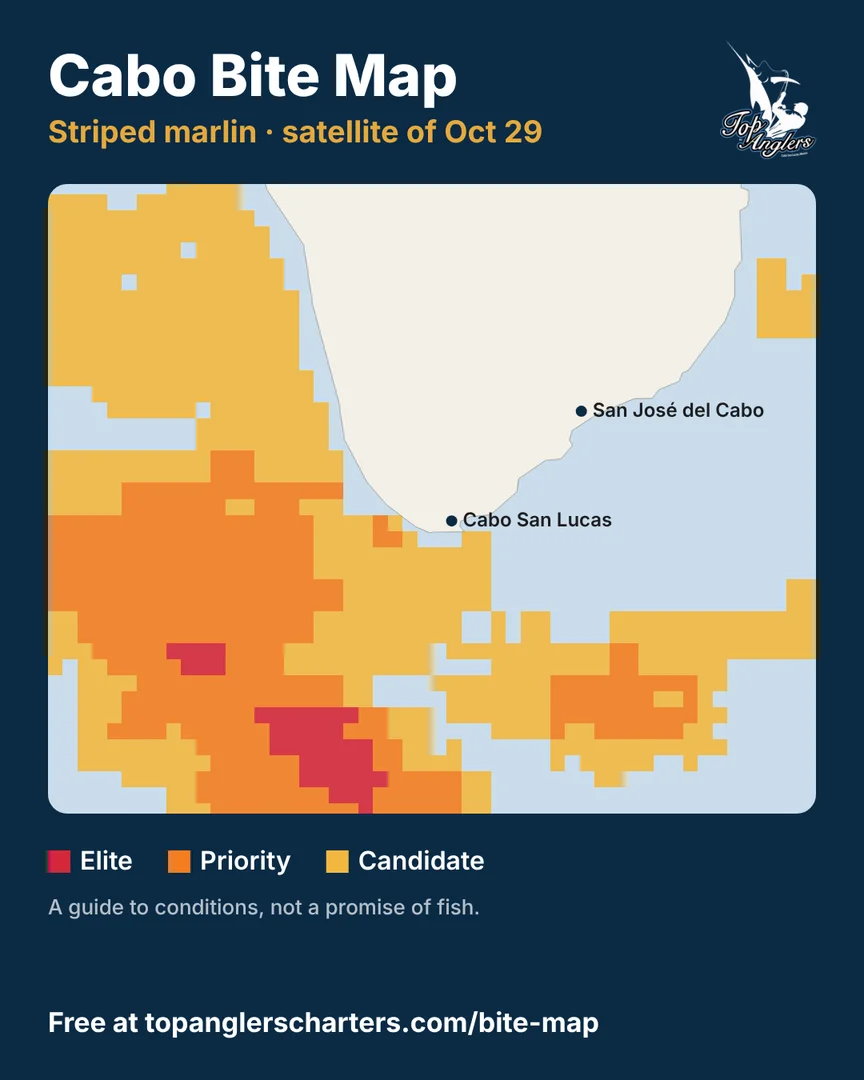
The “Share” button turns today’s map into an image for WhatsApp or Instagram.
How to use it in a minute
- Open the map and pick a fish.
- Choose an area: Los Cabos, Todos Santos, East Cape, La Paz, Magdalena Bay, Loreto, Mulegé, the northern Pacific or all of Baja California Sur.
- Tap any square. You will see its tier, the water temperature, the depth, the nearest port and the reasons it scored well.
Then press Share and send it to your fishing crew. Every map you share carries the date of the satellite image, so nobody mistakes last week’s water for today’s.
Keep it on your phone, like an app
You don’t need an app store. The Bite Map saves to your home screen with the Top Anglers logo and opens full screen, like any other app. On the map page, tap Save it as an app on your phone and follow the steps, or do it yourself:
iPhone (Safari)
- Open topanglerscharters.com/bite-map in Safari.
- Tap the Share button. On newer iPhones it is inside the ••• button next to the address bar.
- Scroll down and tap Add to Home Screen.
- Leave Open as Web App on and tap Add.
Android (Chrome)
- Open topanglerscharters.com/bite-map in Chrome.
- Tap the ⋮ menu at the top right.
- Tap Install app (on some phones it says Add to home screen).
- Confirm with Install.
The icon is the navy Top Anglers logo, and it is called Bite Map. Open it any morning before you fish; it loads the newest satellite data every time.
What it is not
We would rather you trust this map a little than too much, so here are its limits:
- It rates conditions, not fish. Good water is where your odds improve. It is not a promise.
- The satellite is a day or two behind. NOAA publishes images 1–2 days after they are taken, and the sea moves.
- Clouds hide water. Where the satellite could not see, the map says so instead of guessing.
- Inshore fish are scored on a finer grid, but the satellite isn’t. The depth and bottom along the coast come in squares of about 900 meters, while the water temperature and color still come from 5-kilometer satellite pixels, which see less right at the beach.
- It is a beta. We are comparing it with what our captains catch every day and adjusting each species.
And it is not a substitute for a captain. The map sees the surface from space; a captain sees birds working, a color change, the bite from yesterday afternoon. Use it to plan and to learn, and let your captain decide.
The Elite version
Our captains run an extended version in their own app, with ocean currents at five depths, from about 10 to 220 meters, typed GPS coordinates and a full-screen chart. If you want to fish the zones with one of them, book a trip or message us on WhatsApp.
Tell us how it does
If you fish a zone, good day or bad, tell us. Send a message with the species, the date and roughly where you were. Every report makes the map better for the next angler.
Tight lines from Cabo,
Max Vargas and the Vargas family, Top Anglers